
Lipoblastoma : PLAG1 Breakapart FISH

slide 9 of 30


Comments:
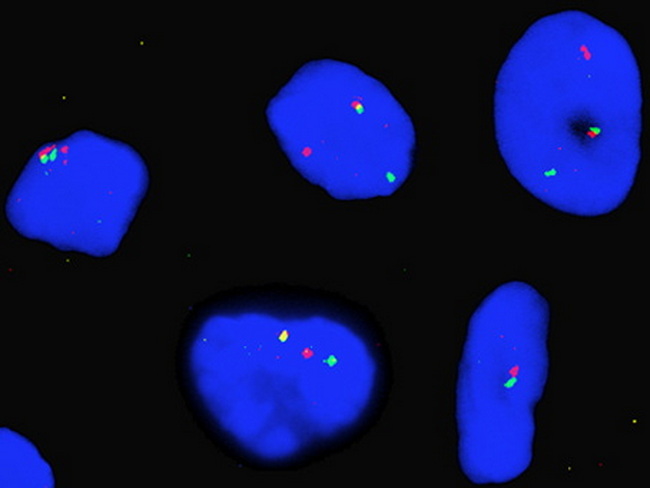
PLAG1 breakapart FISH Result Interpretation: In a normal interphase nucleus, the two orange/green signals co-localize as pairs and represent two non-rearranged 8q12.1 loci. In a heterozygous rearrangement, a tumor cell with rearranged PLAG1 will show one orange/green signal (non-rearranged) and one separate orange and green signal (representing rearranged PLAG1 gene). See previous image for map diagram of PLAG1 breakapart FISH probe. Image source: Gail Aldrete & Charles D. Bangs, Atlas of Genetics and Cytogenetics in Oncology and Haematology. Image used under: Creative Commons Attribution-NonCommercial No Derivative Works 2.0 France License.
slide 9 of 30